Vacancy rates remain stable as year getsoff to a slow start
Executive Summary
- Lease velocity remained virtually unchanged quarter-over-quarter. A total of 35 deals over 10,000 sq. ft. recorded in Q1 2024 compared with 37 deals in Q4 2023.
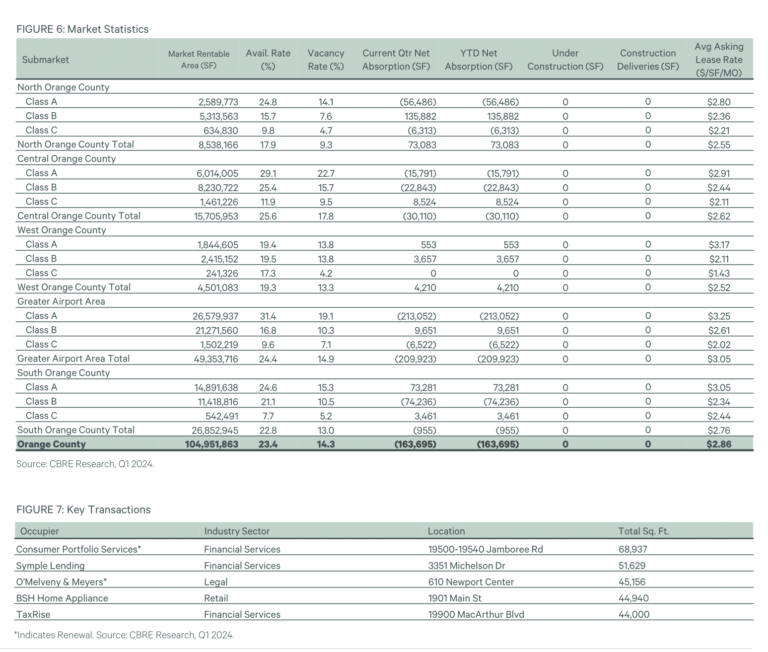
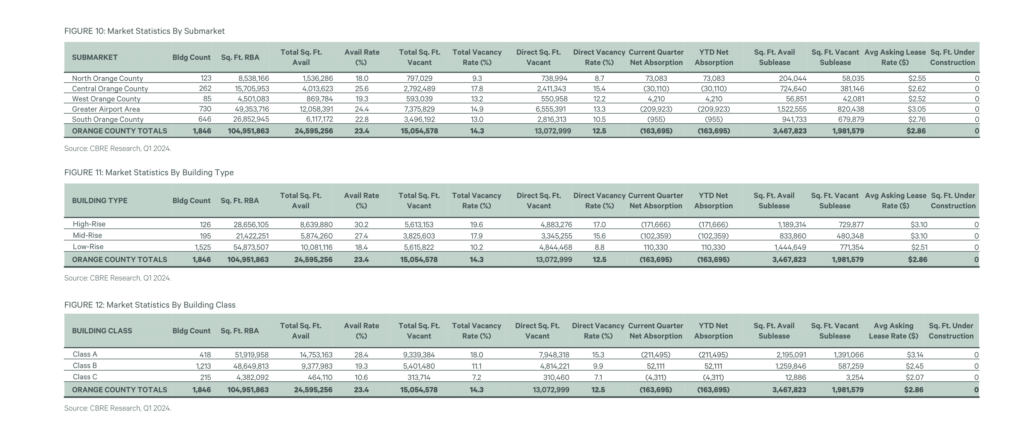
- Despite increased Class A availability with above average rates in the Irvine Spectrum submarket, average asking rates have remained flat throughout the county at $2.86 FSG per sq. ft. per month.
- Availability remained stable quarter-over-quarter at 23.4% in Q1 2024 and vacant space stayed virtually unchanged at just over 15 million sq. ft. as long-term tenant space needs remained in flux.
- Available sublease space decreased slightly quarter-over-quarter by 194,000 sq. ft. to record at just over 3.5 million sq. ft. This was largely due to an uptick of sublease activity of 244,000 sq. ft. leased in Q1 2024.
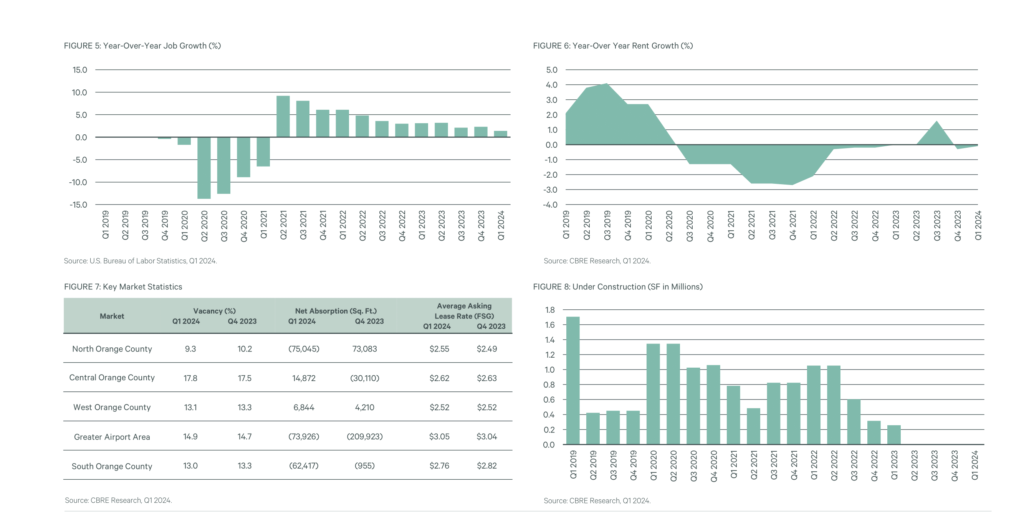
- Net absorption trended in a more positive direction to negative 164,000 sq. ft. in Q1 2024, decreasing from negative 190,000 sq. ft. in Q4 2023. This was driven by the positive gains in the North OC submarket that recorded deals in the real estate, government, and healthcare industries.

OFFICE MARKET OVERVIEW
Market activity in Orange County (OC) remained stable since the end of 2023. Lease velocity stayed consistent quarter-over-quarter, albeit at a much-reduced level when compared to pre- pandemic activity. There were 37 and 35 deals signed for office space over 10,000 sq. ft. in Q4 2023 and Q1 2024, respectively. The overwhelming majority of leased office space continued to be in Class B and Class C spaces under 5,000 sq. ft. The county, already solidified as an
attractive place to do business, continued to attract financial service firms and small to mid-sized legal offices.
Companies continued to solidify their space needs for the short to mid-term period. Most scaled back significantly and showed much less willingness to sign lease agreements for the industry- standard of 5-years. Concessions in the form of free rents remained high as they have become essential in closing a deal. Sentiment among landlords, however, is showing much less willingness to spend on tenant improvements in a unit or overall capital improvements for the entire building.
Companies continued to solidify their space needs for the short to mid-term period. Most scaled back significantly and showed much less willingness to sign lease agreements for the industry- standard of 5-years. Concessions in the form of free rents remained high as they have become essential in closing a deal. Sentiment among landlords, however, is showing much less willingness to spend on tenant improvements in a unit or overall capital improvements for the entire building.
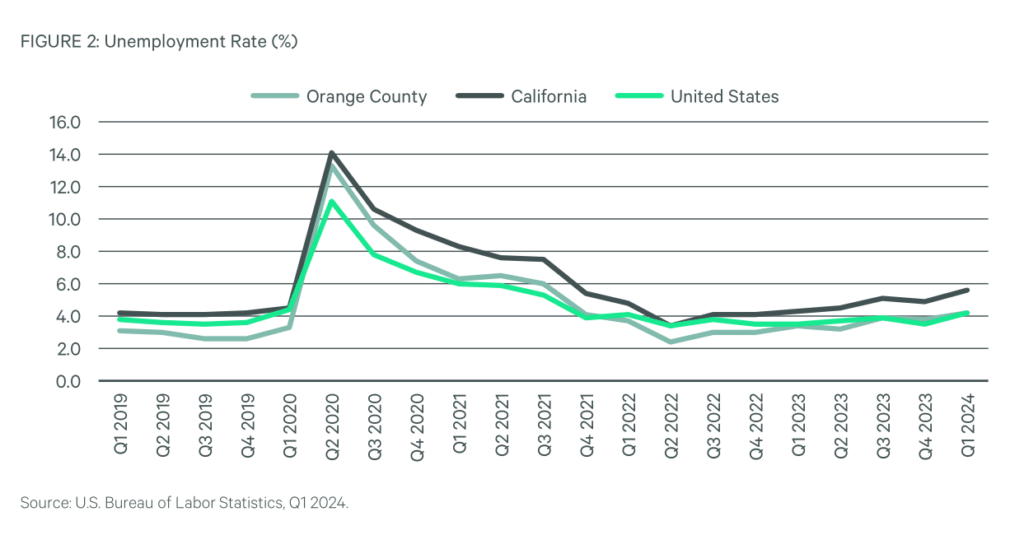
EMPLOYMENT
he unemployment rate in Orange County was 4.2% in February, unchanged from 4.2% in
January, and above last year’s estimate of 3.4%. Orange County’s unemployment rate fell below
California’s unadjusted unemployment rate of 5.6% and was above the nation’s rate of 4.2%.
Between February 2023 and February 2024, total nonfarm employment increased by 1.4%. Private
education and health services gained the most jobs of any sector with an increase of 15,300 jobs
along with the health care and social assistance sector adding 12,900 jobs
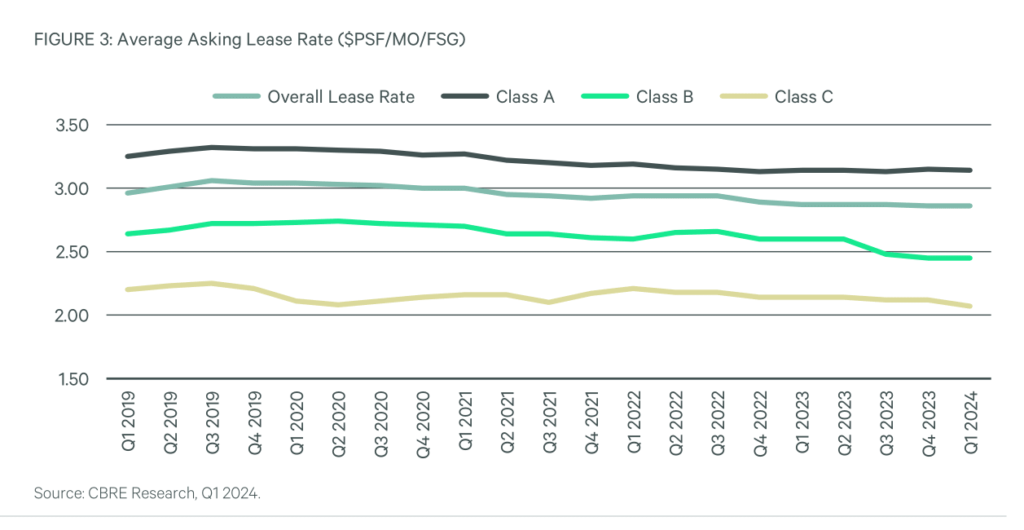
LEASE RATE ANALYSIS
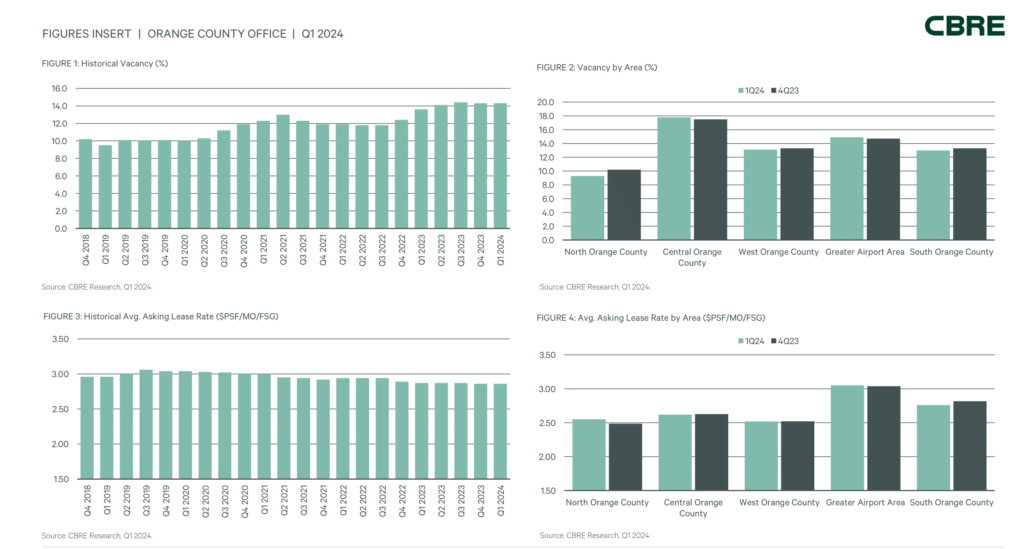
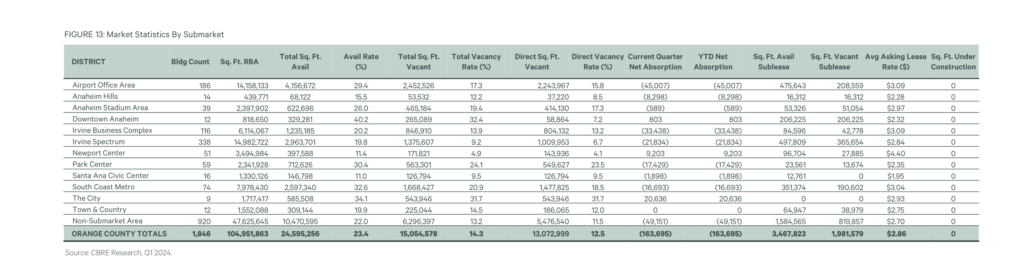
OC’s average asking rate remained flat at $2.86 FSG per sq. ft. per month quarter-over-quarter. This marked the second straight quarter where asking rates remained flat, nearly matching the three consecutive quarters where rates stood at $2.87 FSG in 2023. South OC, with large Class A spaces centered around Irvine Spectrum, commanded the highest asking rates at $3.04 FSG per sq. ft. Other submarkets remained within the low-to-mid $2.00 FSG range.
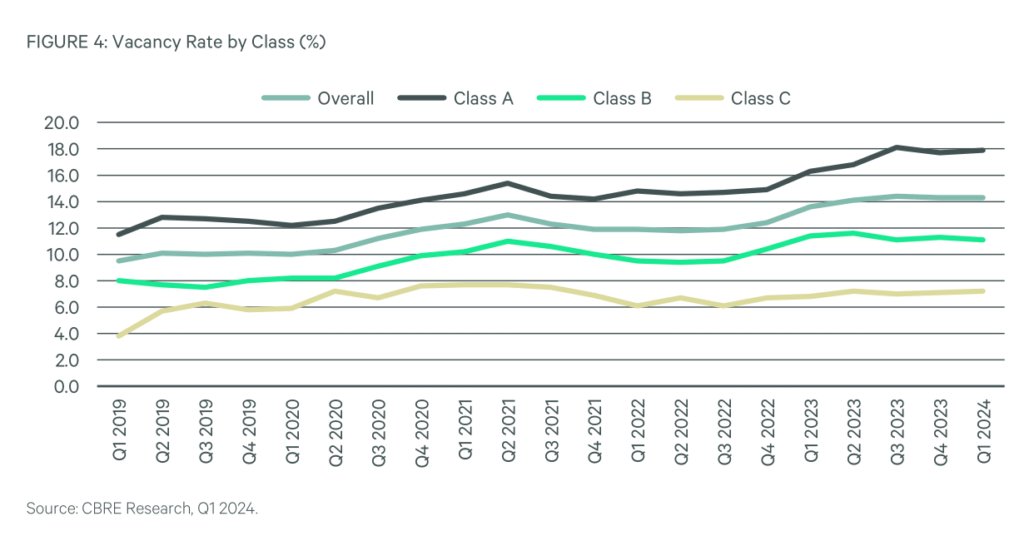
VACANCY & AVAILABILITY
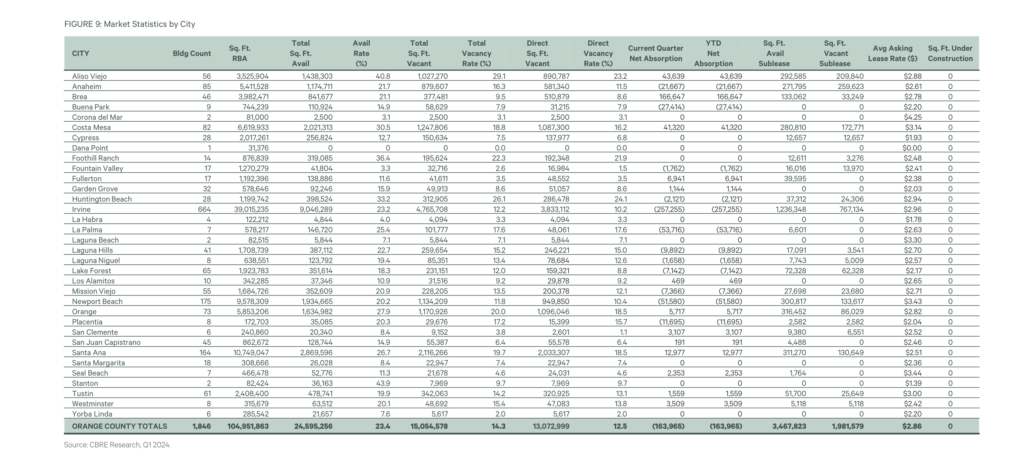
Office vacancy remained the same quarter-over-quarter at 14.3%, which gave an indication that tenants continued to delay office space decisions. The nominal Q1 2024 change was an increase of 190 bps from the 12.4% recorded in Q1 2023 and was largely due to sublease activity of 244,000 sq. ft. leased in Q1 2024. An additional 60,000 sq. ft. of sublease space and 40,000 sq. ft. of direct space became available at 3345 Michelson Dr in Irvine as Providence Health and Alteryx placed spaces on market and moved.
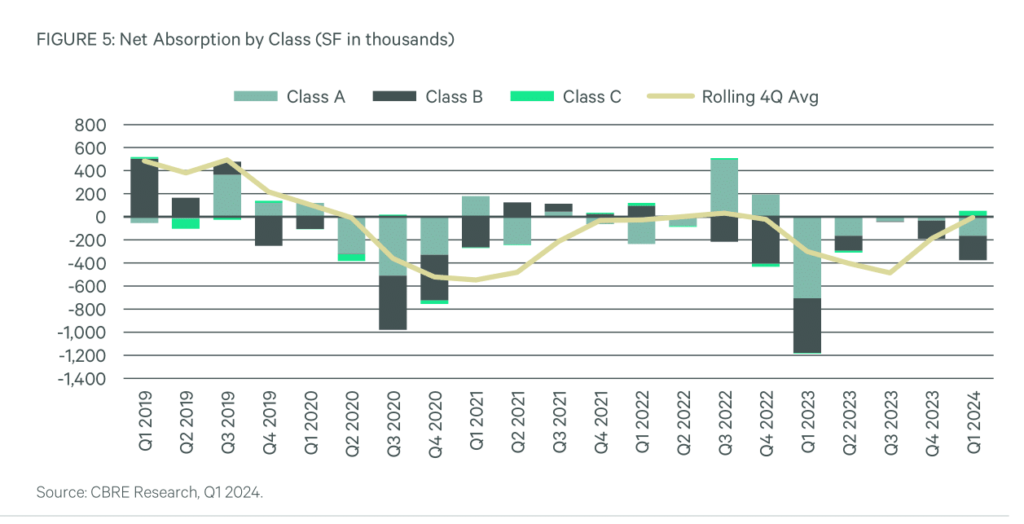
NET ABSORPTION & ACTIVITY
Net absorption continued to slowly improve in 2024. The negative 164,000 sq. ft. indicated significant downsizing by companies across industries as more employees continued to work remotely. The Greater Airport Area submarket, and the city of Irvine specifically, were most affected by this, showing negative 257,000 sq. ft. in Q1 2024. Most notably, significant space reductions were seen in banking and financial services with MeridianLink at 1600 Sunflower Ave
in Costa Mesa, Optima Tex Relief at 3601 S Harbor Blvd in Santa Ana, and Opus Bank at 19900 MacArthur Blvd in Irvine
DEVELOPMENT
In Q1 2024, there were no new office construction or deliveries in OC. A notable shift was observed among office owners exploring conversions to other property types. Demolition began for the two-building office complex in Santa Ana. The site, formerly Elevate at Harbor, will be converted into a logistics warehouse. The lack of construction since Q1 2023 is due to the impact of remote work on the office market as companies continue rightsizing.
INVESTMENT MARKET
OC investment sales transaction volume closed Q1 2024 at $84.4 million, a 41.2% decrease year- over-year according to data from MSCI Real Capital Analytics. Investment activity declined due to ongoing economic pressures and investor caution caused by market uncertainty. Seven Orange County office properties sold in Q1 2024 compared to the 21 properties that sold in Q4 2023. The largest office deal that transacted in Q1 2024 was 1 MacArthur Place in Santa Ana.
Angelo Gordon & Co. sold the 200,000 sq. ft. office building for $31.1 million or $155 per sq. ft.
MARKET OUTLOOK
- Continued economic growth paired with the Fed signaling more accommodative policy all suggests the U.S. economy is heading toward a ‘soft landing’. GDP growth should be less than half 2023’s pace when growth topped 3%. Reasons for the slowdown include a more prudent consumer and much weaker hiring. This latter issue is most acute within interest rate sensitive sectors, such as tech start- ups and goods manufacturing. Notable exceptions include investment in EV and microchip production capacity.
- More caution from businesses means a good chunk of recent hiring came from publicly funded sectors (e.g., education, healthcare, state & local governments). A key exception is leisure and hospitality, driven by continued demand for discretionary services. With many private firms on the sidelines, the job openings rate declined to 5.5% from its peak of 7.8% in 2022. This has also meant the pace of wage growth has cooled, but not enough to see inflation fall quickly to 2%. With unemployment remaining below 4% and high-capacity utilization, CPI is unlikely to return to target until 2025.
- The Fed will likely make three, 25 basis point cuts this year. This outlook is putting downward pressure on longer-term rate expectations, providing some optimism for real estate capital markets, but the recovery will only begin after the first cut is actually delivered. Better than expected growth over the last 18 months has been helpful in holding real estate vacancy down, notably in the industrial, retail and multifamily sectors.
- OC continued to show mixed results. Unemployment notched upward to 4.2% to reach a 2-year high as tech employers adapt to a new economic reality, but overall leasing velocity in the 10,000 to 30,000 sq. ft. range continued to remain stable. Mid-size financial services firms, legal offices, and healthcare companies led all activity in this respect.
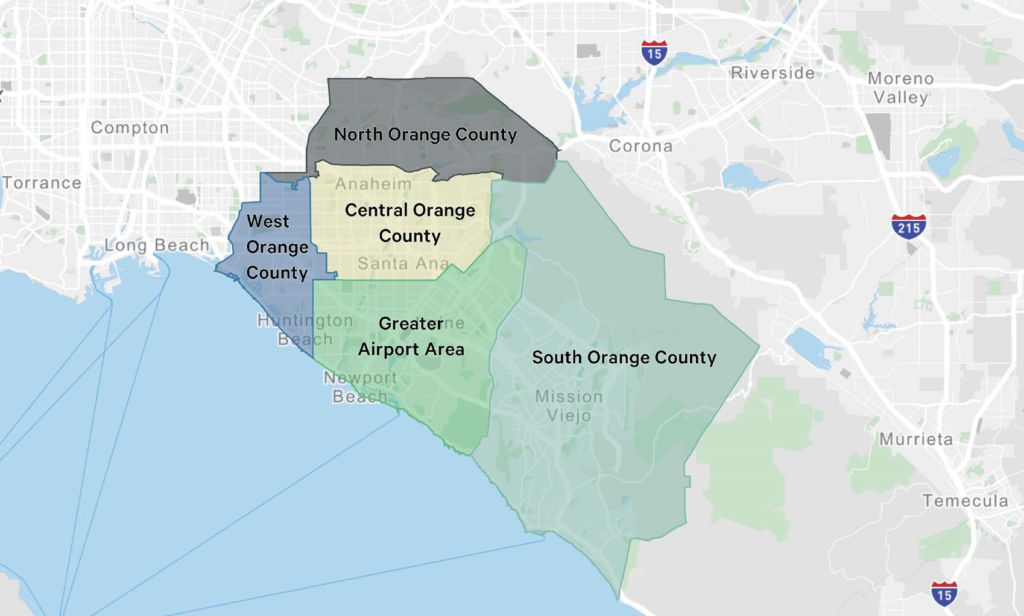
Market Area Overview
Definitions
Net Rentable Area The gross building square footage minus the elevator core, flues, pipe shafts, vertical ducts, balconies and stairwell areas. Available Sq. Ft. Space Available for lease which is either physically vacant or occupied. Includes Subleases. Vacant Sq. Ft. Portion of Available sq. ft. which is either physically vacant or immediately available. Includes Subleases. Direct Vacancy Sq. Ft. Portion of Available sq. ft. which is either physically vacant or immediately available. Excludes subleases. Vacancy Rate Vacant sq. ft. divided by the NRA. Occupied Sq. Ft. NRA not considered vacant. Net Absorption The change in Occupied sq. ft. from one period to the next. Positive absorption is reflected when a lease is signed, which may not coincide with the date of occupancy. Average Asking Lease Rate The rate determined by multiplying the asking gross lease rate for each building in the summary by its associated available space, summing the products, then dividing by the sum of the available spaces with gross lease rates for all buildings in the summary. Direct leases only; excludes sublease space and parking charges. Full Service Gross (FSG) Lease Type whereby the landlord assumes responsibility for all of the operating expenses and taxes for the property. Normalization Due to a reclassification of the market, the base, number and square footage of buildings for previous quarters have been adjusted to match the current base. Availability and Vacan cy figures for those buildings have been adjusted in previous quarters.
Survey Criteria
Includes all Class A and B multi-tenant office projects 30,000 sq. ft. and greater in size, excluding government, medical, and owner-user buildings. Excludes buildings Under Construction or Planned. Under construction buildings which have begun construction as evidenced by site excavation or foundation work. Sean Freeman
Contacts
Sean Freeman
Senior Field Research Analyst
Orange County
sean.freeman@cbre.com
Connor Wilde
Deepa Shah
Source: CBRE Research, Q1 2024, Location Intelligence
© Copyright 2024 All rights reserved. Information contained herein, including projections, has been obtained from sources believed to be reliable, but has not been verified for accuracy or completeness. CBRE, Inc. makes no guarantee, warranty or representation about it. Any reliance on such information is solely at your own risk. This information is exclusively for use by CBRE clients and professionals and may not be reproduced without the prior written permission of CBRE’s Global Chief Economist.