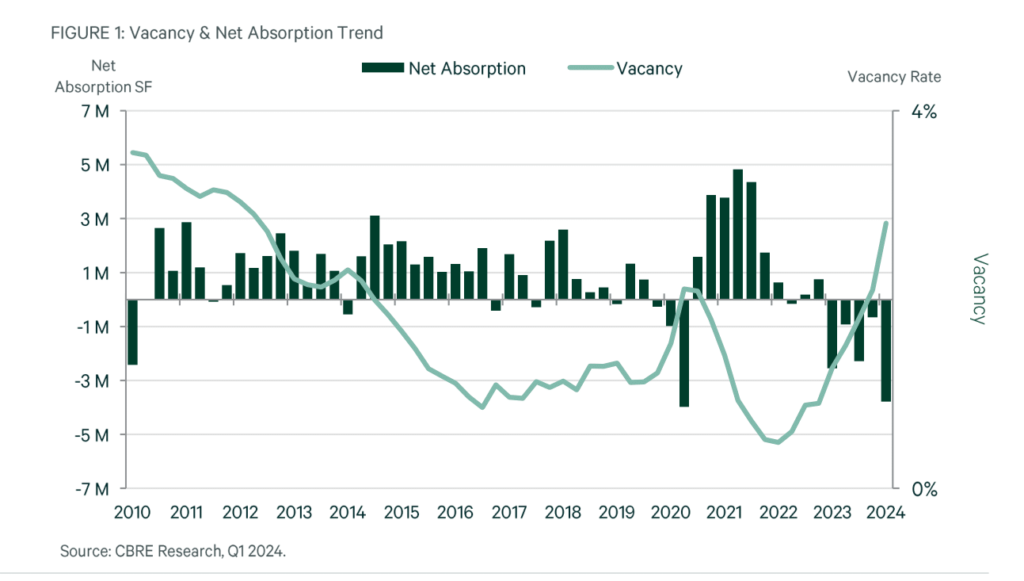
Market fundamentals challenged by fifth consecutive quarter of negative net absorption
MARKET HIGHLIGHTS
- The vacancy rate increased to 2.7% in Q1 2024 driven by 3.8 million sq. ft. of negative net absorption.
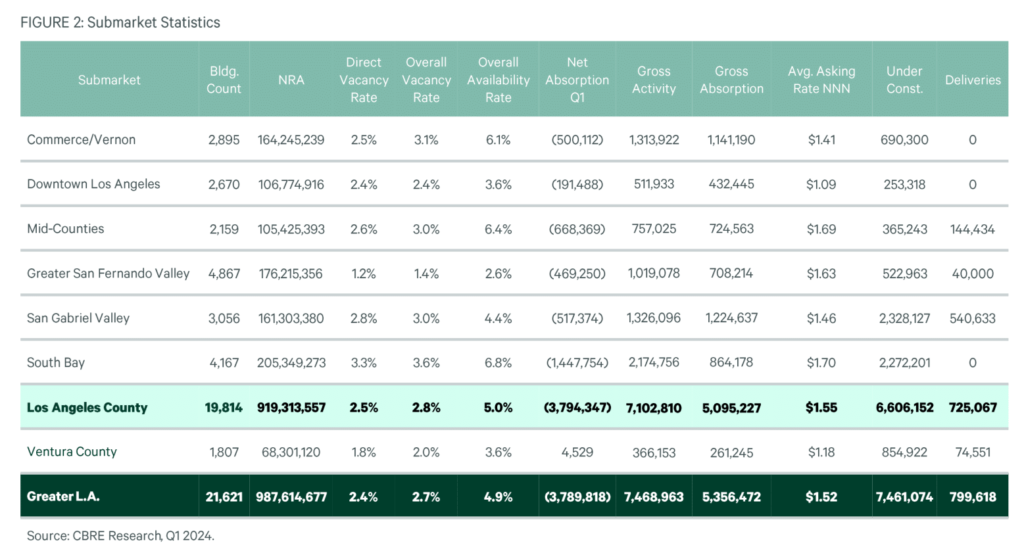
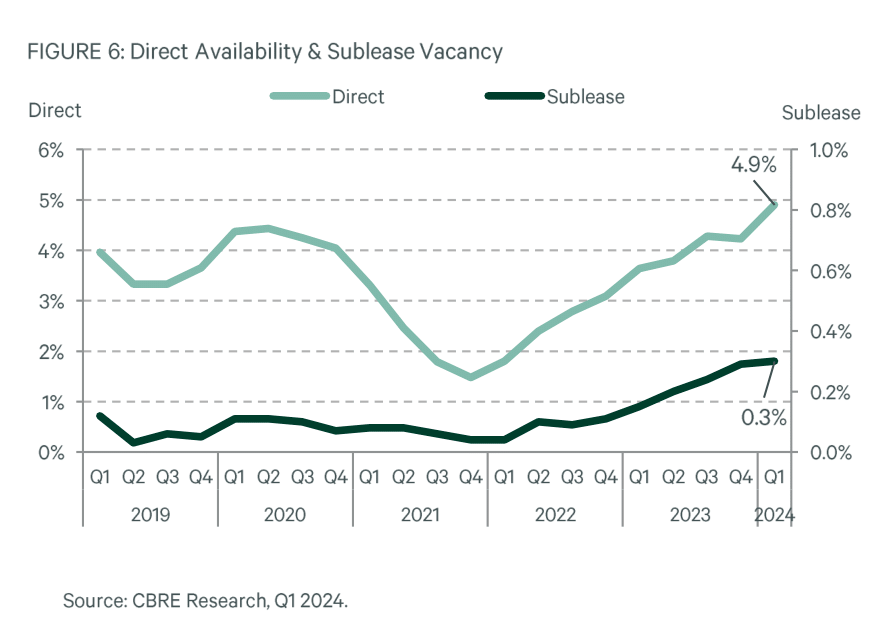
- The availability rate increased to 4.9% from 4.2% in Q4 2023.
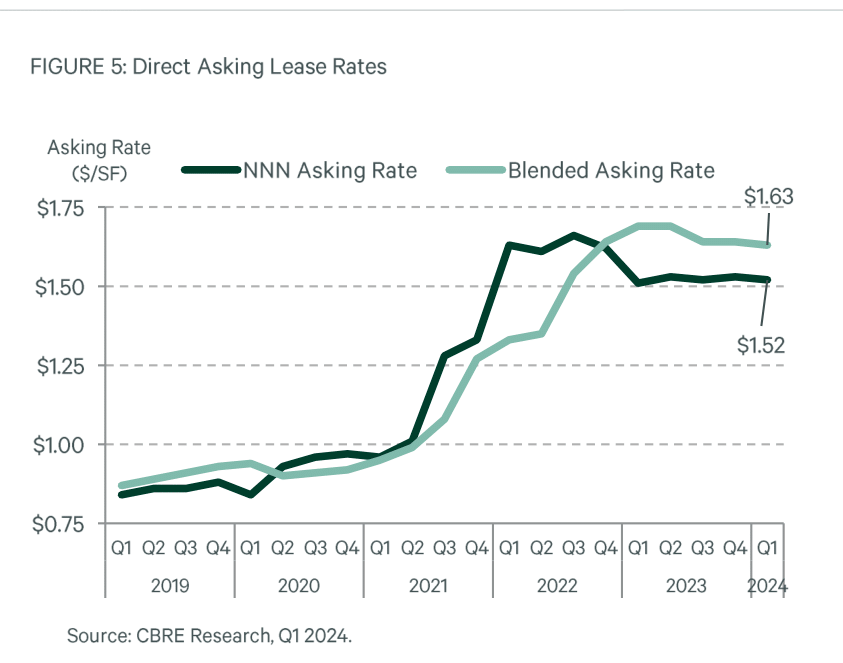
- The average direct asking rate decreased by $0.01 to 1.52 NNN. Quarter-over-quarter. Since reaching its peak in Q3 2022, the average asking rate has declined by 7.8%.
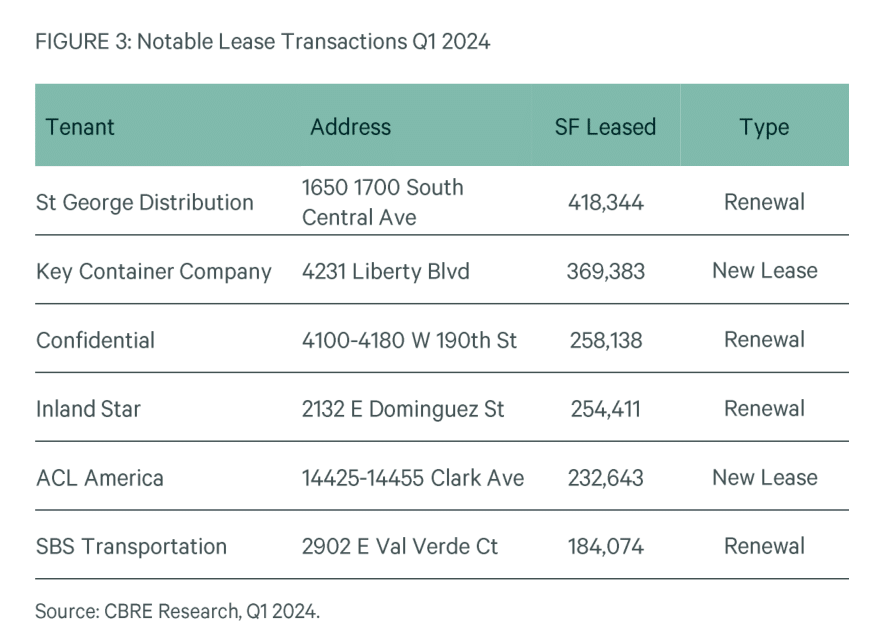
- Total leasing activity, bolstered by large renewals, was just under 7.5 million sq. ft. in Q1 2024
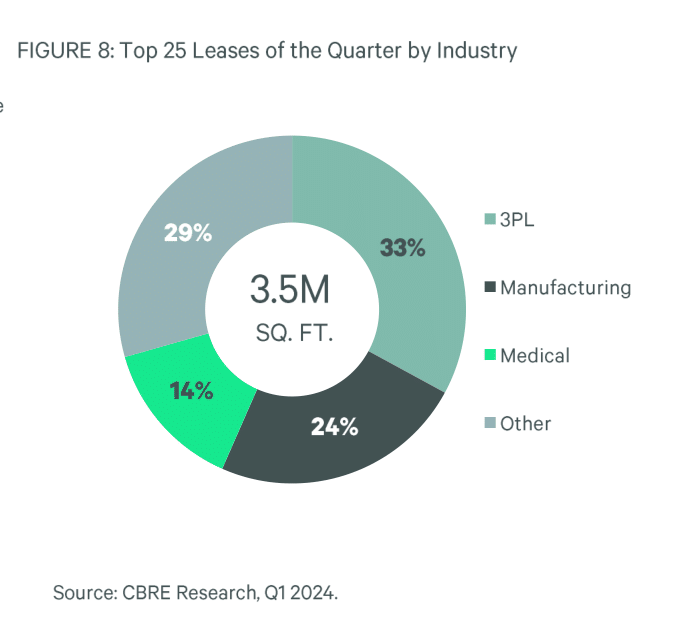
- In Q1, 2024 three of the top five leases signed were distribution and 3PL occupiers, two of which were new deals.
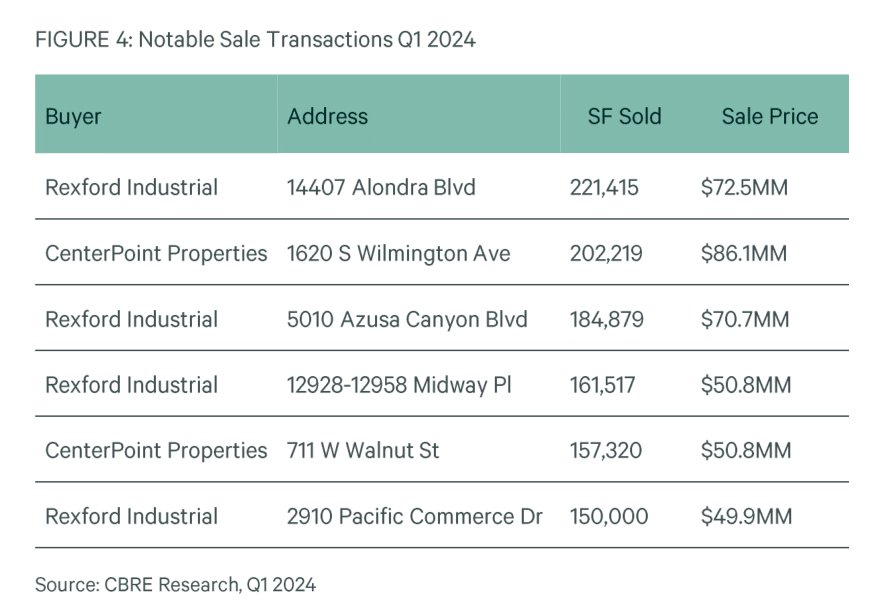
- Rexford Industrial Realty bought 2.4 million sq. ft. of L.A. County industrial property for over $808 million in Q1.
- Ninety-six sale transactions closed in Q1 2024 over 10K sq. ft. in size, totaling to 4.7M sq. ft. or $1.5 billion dollars.
MARKET OVERVIEW
- In Q1 2024, all submarkets within Greater Los Angeles (GLA) were challenged due to heightened vacancy and availability. Asking rates have decreased in certain regions, and tenants remained highly focused on price, taking longer to finalize deals. To stay competitive, landlords reduced rates in some cases, and provided concession packages.
- The average asking lease rate for GLA decreased to $1.52 NNN per sq. ft. (PSF), a $0.01 decline from the previous quarter. The South Bay and the San Gabriel Valley experienced the largest decline of $0.06 quarter-over-quarter, with rates of $1.70 NNN PSF and $1.46 NNN PSF, respectively. The Mid Counties saw a gain of $0.06 quarter-over-quarter, reaching $1.69 NNN PSF. The Greater San Fernando Valley remained stable with a $0.02 increase, posting a rate of $1.63 NNN PSF in Q1 2024
- Gross activity across GLA totaled 7.5M sq. ft., representing a 10.2% increase quarter-over-quarter. The increased activity was driven by a handful of large renewals in the 100K to 500K sq. ft. size range in the South Bay market. The South Bay market reported the most gross activity at 2.2M sq. ft., followed by Central Los Angeles at 1.8M sq. ft., and the San Gabriel Valley at 1.3M sq. ft. The Greater San Fernando Valley reported 1.0M sq. ft. and the Mid-Counties reported 757K sq. ft.
- Net absorption in Q1 2024 reported negative 3.8M sq. ft. Every submarket posted a negative figure aside from Ventura County. Overall vacancy and availability increased in GLA quarter-over-quarter with vacancy going from 2.1% to 2.7%, and availability from 4.2% to 4.9%, contributing an additional 5.9M sq. ft. and 7.1M sq. ft., respectively.
- Overall sales volumes increased in Q1 2024 from Q4 2023 following decelerated activity in the second half of 2023. While challenges remain in the capital markets sector, overall volumes increased driven by Rexford Industrial Realty’s acquisition of Blackstone’s portfolio. Institutional buyers drove the largest share of acquisitions activity, followed by private buyers, and owner-users.
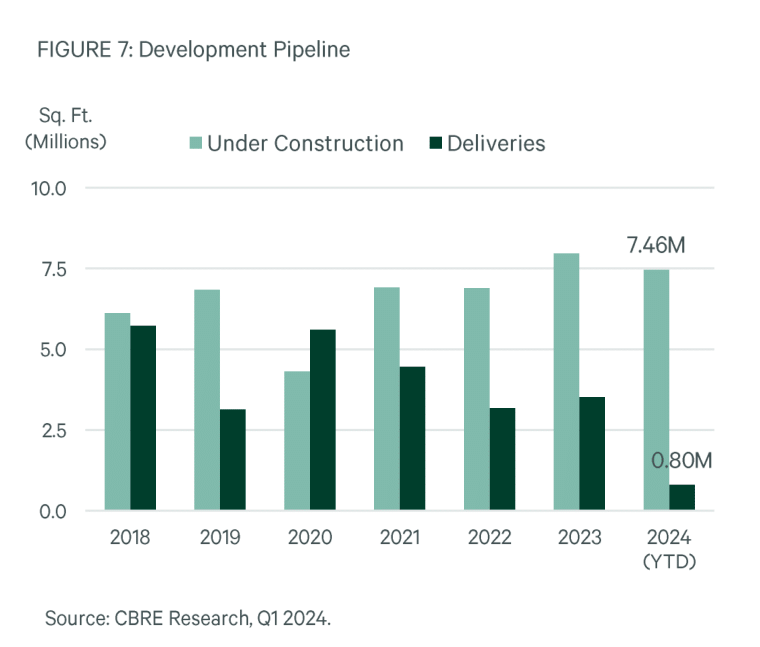
- Industrial properties under construction in Greater Los Angeles totaled 7.5M sq. ft. In Q1 2024, 800K sq. ft. delivered. The San Gabriel Valley led the way in deliveries with 541K sq. ft. of completions, including the 261K sq. ft. warehouse 905 Live Oak, Building 2, in Irwindale
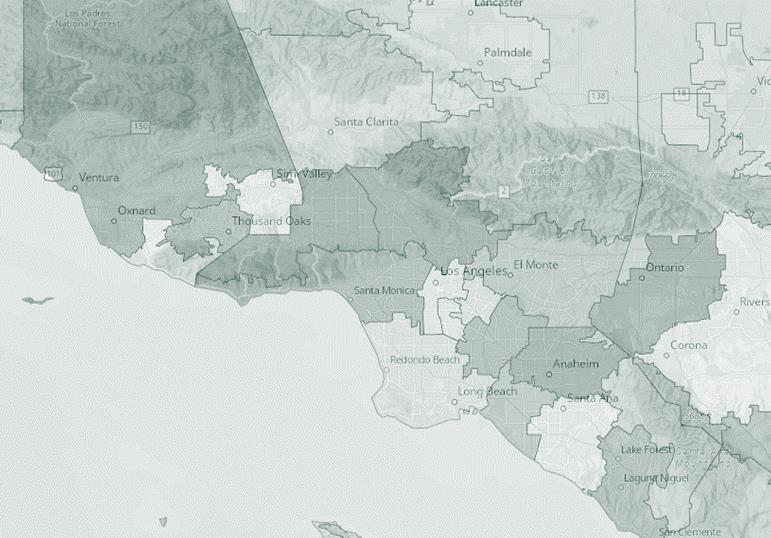
Submarket Map
Definitions
Available Sq. Ft: Space in a building, ready for occupancy; can be occupied or vacant. Availability Rate: Total Available Sq. Ft. divided by the to: al Builcing Area. Average Asking Lease Rate: A calculated average that includes net and gross lease rates. weighted by their corresponding available square footage. Building Area: The total floor area sq. ft. of the building, typically taken at the “drip line” of the building. Gross Absorption: All user-sales and lease transactions completed within a specified period, lease activity defined as new leases and expansions, omitting renewals unless publicly marketed, and sale activity omitting only investment sales. Gross Activity: All user-sales and lease transactions completed within a specified period. Gross Lease Rate: Rent typically includes real property taxes, building insurance, and major maintenance. Net Absorption: The change in Occupied Sq. F from one period to the next. Positive absorption is reflected when a lease is signed, which may not coincide with the date of occupancy. Net Lease Rate: Rent excludes one or more of the “net” costs (real property taxes, building insurance, and major maintenance) typically included in a Gross Lease Rate. Occupied Sq. Ft: Building Area not considered vacant. Vacancy Rate: Total Vacant Sq. Ft. divided by the total Building Area. Vacant Sq. Ft: Space that is not occupied.
Survey Criteria
Includes all industrial buildings 10,000 sq. ft. and greater in size in Los Angeles and Ventura counties. Buildings which have begun construction as evidenced by site excavation or foundation work
Contacts
Alex Hall
Siyuan Ma
Matthew Hocum
Matthew Hocum
Matthew Hocum
David Cannon
Carter Chillingworth
Maxine David
Aidan Carlisle
Konrad Knutsen
Source: CBRE Research, Q1 2024, Location Intelligence
© Copyright 2024 All rights reserved. Information contained herein, including projections, has been obtained from sources believed to be reliable, but has not been verified for accuracy or completeness. CBRE, Inc. makes no
guarantee, warranty or representation about it. Any reliance on such information is solely at your own risk. This information is exclusively for use by CBRE clients and professionals and may not be reproduced without the
prior written permission of CBRE’s Global Chief Economist.